
The classic conjoint question asks people to choose one of the alternatives. This generates nominal data. There are many other scales that can be used, leading to different types of data being collected, including:
Choices
As the name suggests, choice-based conjoint studies ask people to make a choice, and the resulting data is nominal.
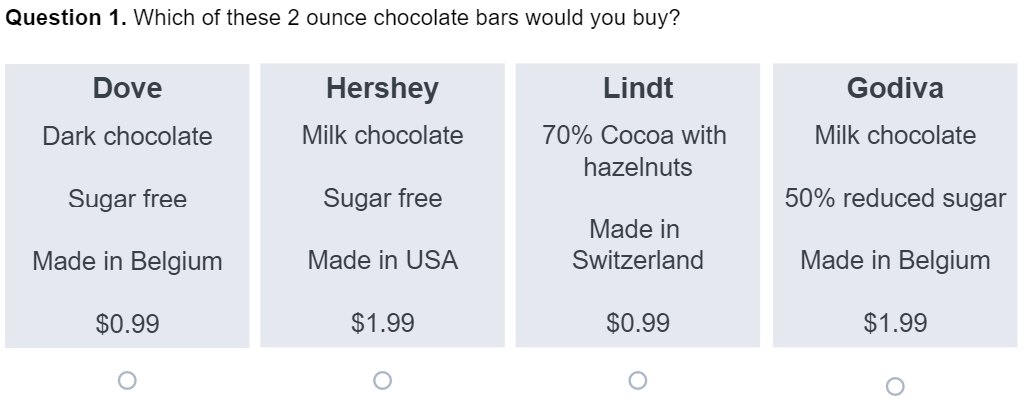
Due to its superior ecological validity, for most problems, this likely produces the highest quality data. However, there are other approaches that collect more data, leading to smaller sample sizes being required.
Dual-response
Dual-response conjoint is an alternative to choice-based conjoint questions that contain a 'none of these' alternative. First, a question is shown with no 'none of these' option. Then, after making their choice, the respondent is asked if they would in reality choose the option that they chose.
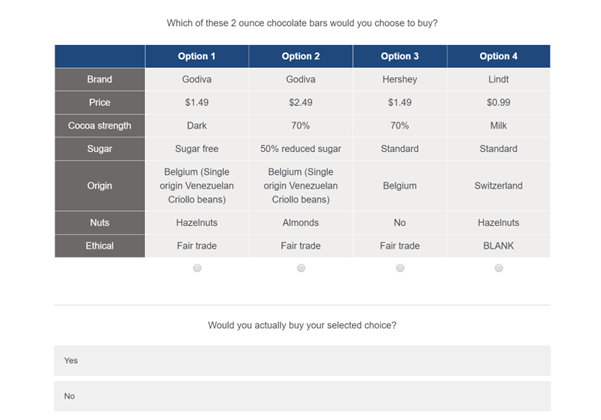
Dual-response adds to fatigue and the questions have poor ecological validity (i.e., in the real world most people do not first choose which they prefer most and then decide not to buy any of them, although, of course, this does happen from time to time).
A more technical problem is that there is no obviously-valid way to analyze the resulting data, with the two most popular methods providing different results and there being no obvious way to work out which is better.
Best-Worst
Best-worst conjoint shows the respondent three or more alternatives and asks which they would choose and which they would be least likely to choose.
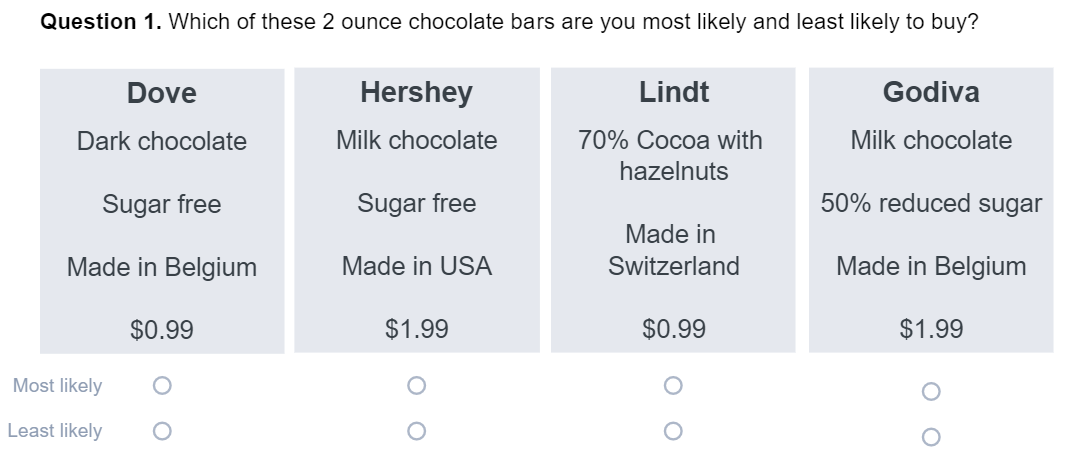
Best-worst conjoint adds to fatigue and the worst choice suffers from is inherently unrealistic for the same reason as with ranking.
Rankings
The respondent is asked to rank the alternatives. Where only a single question is asked, this is known as conjoint analysis or ranking-based conjoint analysis.
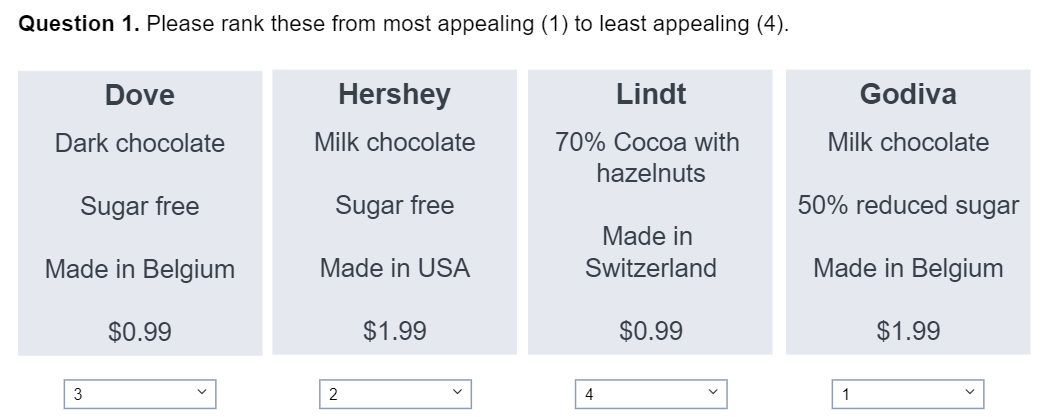
Sometimes partial rankings, are used, where people are asked to choose, say, their first and second preferences.
Ranking increases fatigue and the question is inherently unrealistic. That is, in the real-world people choose to buy products or not; they do not rank them. Further, we can expect that lower rankings will have more noise, which violates the assumptions of all the widely-used models.
Ratings
Respondents can also be asked to provide ratings of alternatives (e.g., out of 10). Where only a single question is asked, this is also known as conjoint analysis or rating-based conjoint analysis.
Ratings have the same problem as rankings and also make analysis more difficult due to scale-response usage biases and the difficulty of making forecasts. In a traditional choice-based conjoint, the choices can be used as proxies for choices in the real world. With ratings, there is no easy-to-justify approach to converting predicted ratings to market share or sales (despite more than 60 years of effort in trying to develop such approaches).
Constant-sum
Constant-sum questions ask respondents to allocate a specified number of “tokens” or purchases (e.g., 10) to the alternatives according to their preference.
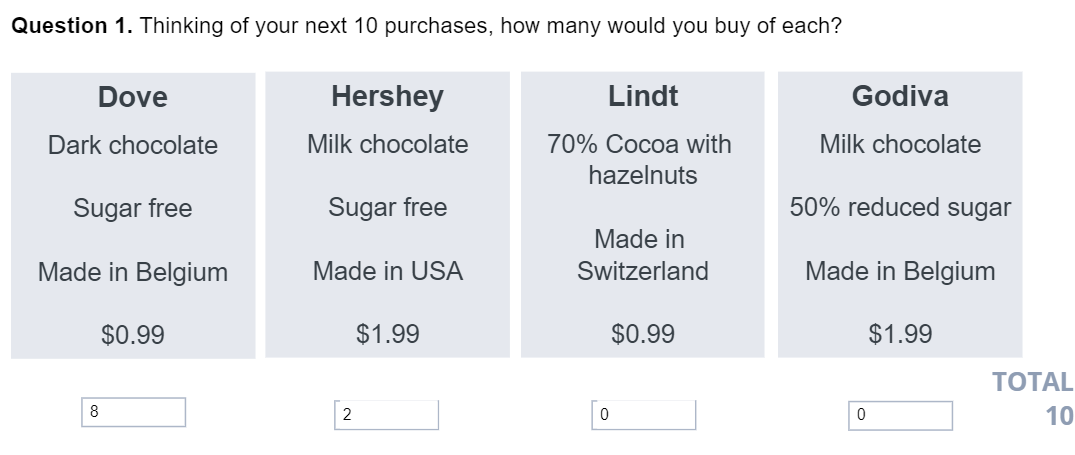
Constant-sum data leads to lower rates of survey completion and different conclusions than choice questions (Chris D. Skedgel, Allan J. Wailoo, Ron L. Akehurst (2015), Health Expectations, 18(5), 1227-1240.). Further, valid analysis of the data is extremely complex. Consider the situation where a respondent allocates 2 of their next 10 purchases to one alternative and 8 to another. If the allocation reflects uncertainty, then the data can be readily analyzed (by just treating it as if the person had answered 10 questions). However, if instead, the choices reflect variety-seeking or household purchasing – e.g., 2 are purchased for me, and the other 8 for other members of the household) – we end up with data that cannot be appropriately analyzed with standard algorithms (which assume that they are estimating a single set of preferences for each respondent).
Volumetric
Volumetric questions ask people to indicate how many of each alternative they would buy.
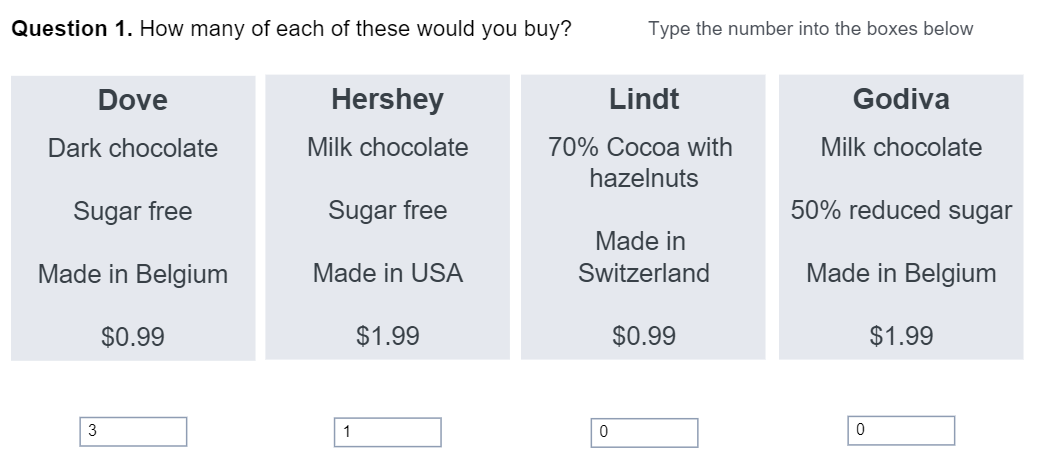
Volumetric data is difficult to analyze and fatigue-inducing for respondents. There are perhaps no studies that demonstrate the problems with fatigue, but as the data is richer than any of the other types, and the other types do induce fatigue, the level of fatigue must be greater.
In addition to having all of the problems of constant-sum data, there is also the need to model the difference in overall quantity, which is extremely difficult to do validly (see Greg Allenby, Peter H. Rossi, and Rob McCulloch (2005), Bayesian Statistics and Marketing. Wiley).
Comments
0 comments
Please sign in to leave a comment.