
Consider a study showing that 65% of 43 people aged 18 to 24 prefer Coca-Cola compared to 41% of 39 people aged 25 to 29. If we wish to test whether the difference between these proportions is significant, we need to compute a p-Value (see Formal Hypothesis Testing for a general discussion of the logic of statistical testing).
The standard test of proportions
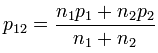
Introductory statistics courses and textbooks present a standard test of the difference between proportions.
Where ![]() and
and ![]() are the two proportions and
are the two proportions and ![]() and
and ![]() are the sample sizes:
are the sample sizes:

where:
- z is evaluated using a standard normal distribution.

The analysis of weighted data
The standard test makes a technical assumption known as i.i.d.. When data is weighted this assumption is violated.
The most straightforward modification of the test in this situation is to replace the sample size by the effective sample size and to compute ![]() using the weighted sample size. This approach is adopted by most of the widely used commercial market research programs (e.g., SPSS IBM Data Collection Model programs, Uncle, WinCross, CfMC, Quantum), although sometimes with additional minor variations (e.g., Yate's correction). These programs also commonly treat the test-statistic as a t-statistic, variously computing the number of degrees of freedom as the sum of the effective sample sizes and minus one or minus two.
using the weighted sample size. This approach is adopted by most of the widely used commercial market research programs (e.g., SPSS IBM Data Collection Model programs, Uncle, WinCross, CfMC, Quantum), although sometimes with additional minor variations (e.g., Yate's correction). These programs also commonly treat the test-statistic as a t-statistic, variously computing the number of degrees of freedom as the sum of the effective sample sizes and minus one or minus two.
A more rigorous approach is to use variance estimation to calculate the standard error, as is done in Q, Displayr, SPSS Complex Samples, the R Survey Package, and the statistical software used by government statistical agencies..
Comments
0 comments
Please sign in to leave a comment.