
A data editor is a view of data that appears in sophisticated analysis software. It has two roles:
- It allows you to look at raw data, in much the same way as a table of raw data.
- You can modify the data by interacting with the data editor. For example:
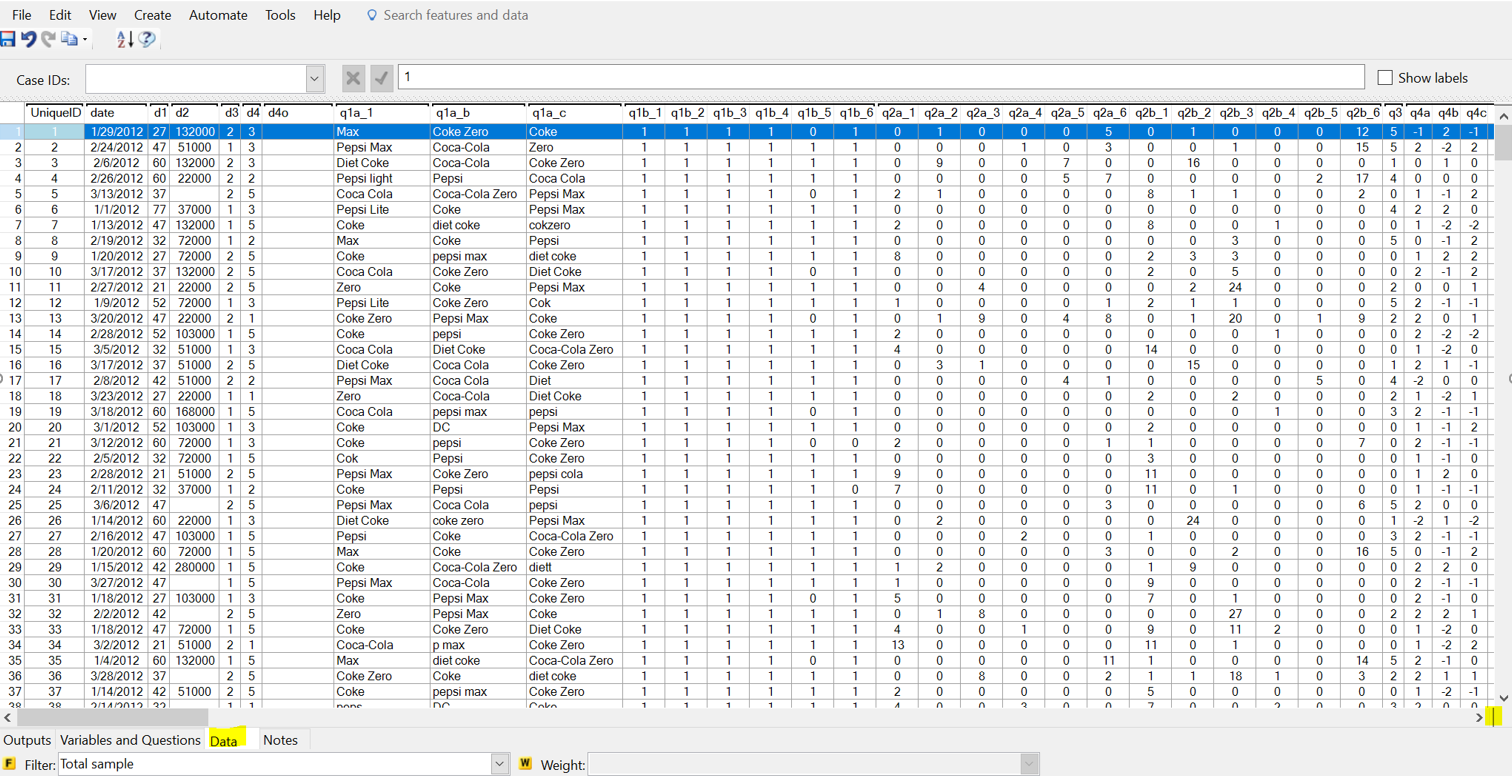
The screenshot below is Q's Data tab, which is one of the four main work areas in Q. It is selected by clicking on Data, at the bottom-left of the screen. It displays a large table, showing all the raw data in the survey. In addition to viewing the data, you can perform many manipulations of this table, such as:
- Sorting
- Deleting rows
- Filtering (which makes the rows go green).
- Viewing the value labels (by checking Show labels, top-right).
- Simultaneously looking at different regions of the data by using the splitter (highlighted in yellow, at the bottom-left of the diagram below).
Comments
0 comments
Please sign in to leave a comment.