
The crosstab below shows the relationship between two questions:
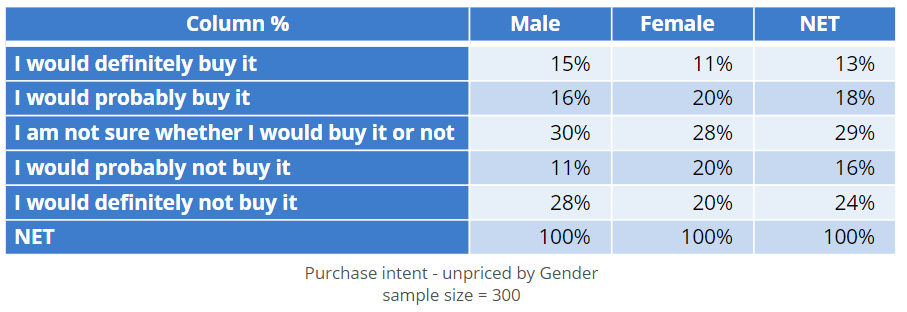
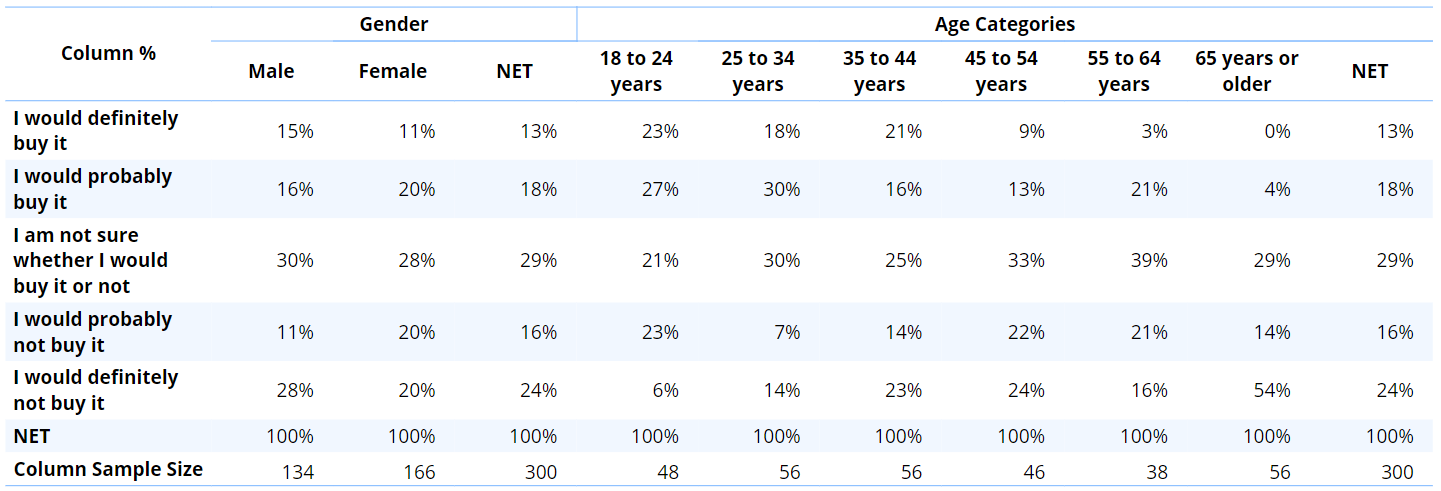
Many survey researchers create tables that contain multiple questions across the top. For example, the table below shows purchase intent (rows) by gender and age.
With such big tables, the columns are often referred to as a banner and the rows as stubs. It is common that these bigger tables also contain multiple statistics (e.g., column %, row%, and count) In this example, the column percentage is shown in every cell, with the sample size for the columns shown in the bottom row.
Comments
0 comments
Please sign in to leave a comment.