
In order to obtain meaningful analyses from a data set, it's necessary for the file to have sufficient metadata to make the meaning of any analysis clear. There is no golden rule about which metadata is required, but the more the better. Key metadata are:
- Source
- ID Variable (key)
- Variable metadata
- Variable set metadata
- Sampling metadata
Source
The source of the data set is information that explains where it has come from. This can be in any number of formats. From simple text description (e.g., "Random sample of Australian Adults, Collected by TNS 3 April to 5 June 2022", through to a SQL query and the data it was run.
ID variable (Database key)
Ideally, a data set will contain an ID variable, also known as a unique identifier, which makes it easy to cross-reference the data in the data set with other data. For example, if the data set represents data from a customer database, the customer number could be included in the data set as the ID variable.
Where the data is extracted from a relational database, the ID variable is often referred to as the key for the table from which it is extracted.
Variable metadata
In order to correctly interpret the data in a variable, we need to have some additional data. This additional data is known as metadata (i.e., data about data).
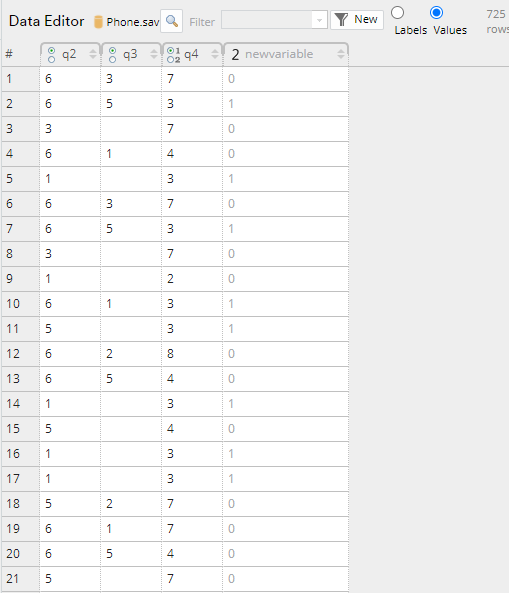
Consider the q4 variable shown above. Efficient interpretation requires the following metadata:
- Variable name. In the case of age in this example, the variable name is q4. The variable name is often used as a shorthand to describe the data when writing code to automate data analysis. Most programs have rules regarding what can be in a variable name, such as that it starts with a letter, and contains no spaces or unusual symbols. Typically, the variable names are short to aid in the typing and reading of the code (e.g., q8a1).
- Variable label. The variable label is typically used in reporting. Sometimes it may be short, like Age, and other times it may be more descriptive (e.g., Q4. What is your age?).
- Type. This is information about how the variable should be stored and processed, and usually includes one or more of the following concepts:
- The data type stores the values, and depends on whether the data is a string, logical (Boolean), integer, floating-point number, or some other data type (e.g., in R, a matrix, vector, etc.).
- The scale properties of the data govern how it should be analyzed. Whether it is nominal (unordered), ordinal (ordered), or numeric.
- Measurement scale. The measurement scale determines how a variable should be analyzed (e.g., as percentages or as averages). See Overview of Data Types.
- Code/Expression. When a variable has been derived, the expression used to derive the variable is often included in the metadata (e.g., q2 + Q3 * 4). This allows the variable to be automatically updated if the inputs change.
- Value attributes, refer to the unique values that a variable can take and each of its metadata. For example, in the age data, a value of 3 indicates an age of 20-24 yrs, a value of 4 indicates 25-29 yrs, etc.
- Missing values. Looking at q3, which contains occupation data, we have blank values for some of the cases. In this example, a blank value indicates that we do not know the occupation. However, there there are other symbols that could be used, such as NA, NAN, SYSMIS, 99, 999, and -99, To correctly interpret data, we need to know what values are used to denote missing values.
- Comments. This is additional information that helps people interpret the variable. For example, it may contain the variable’s change log (i.e., changes in how the variable has been cleaned or modified over time) or known issues.
- Instructions regarding how the data is to appear when viewed, such as the number of decimals, the width of the columns, and currency symbols.
- Data Reduction. This is the set of rules that govern how specific values are to be combined when performing some analyses. For example, the values of 18, 19, 20, 21, 22, 23, and 24, may all be grouped into a new combined category with a label of 18 to 24, the values from 18 to 49 may also be included in a second overlapping category, and so on. As the term “data reduction” is not widely used, there is no standard terminology for this idea.
Variable set metadata
A variable set is a group of one or more structurally related variables (i.e., variables that typically need to be analyzed jointly). Common examples include:
- Multiple responses sets. For example, answers to the survey question “Which of these colas have you purchased? Coke, Pepsi, Dr. Pepper, Pibb, Pepsi Max, None of These?”
- Compositional/constant-sum For example, three variables measuring the proportion of phone calls that a person makes to other people on the network in their country, to other people in the network in a foreign country, to people in their country on another network, and to people in another network in another country.
- For example, “On a scale of 1 to 5, how satisfied are you with your bank, internet company, local McDonalds?".
- Sequences and rankings. For example, “Looking at the products below, please rank them in order of preference, with the one you like most at the top, the second one in second place, etc.”.
- Experimental data. For example, one variable shows what was selected and another shows what the experimental manipulation was.
- Value and unit. For example, one variable contains people’s weights, and the second records the unit it is measured in.
Variable set metadata consists of:
- The list of variables in the variable set.
- The type of the variable set (e.g., is it a ranking, is it constant-sum data).
- Any other metadata common to the variable set.
Change logs
Change logs contain information about changes made to the metadata. If the wording of a question in a survey is changed, the change log will show what was changed, when, and why.
Sampling metadata
Sometimes data has been obtained by sampling. For example, data sets extracted from large databases may only contain a sample of 1% of the records in the database. Or, a survey may contain a sample of 300 people from a population of 300 million people.
Depending on how the data has been sampled, additional metadata may be required for correct analysis, including:
- A variable containing the sampling weight.
- A variable set containing replication weights.
- Strata and their size in the population.
- Ths size of the population.
- Whether sampling was with or without replacement.
- Cluster membership.
- Callbacks.
Comments
0 comments
Please sign in to leave a comment.