
This article describes how to check weights. It uses a case study and discusses:
- Comparing weighted tables of adjustment variables with the targets
- Comparing weighted and unweighted tables of key variables
- Checking the average of the weight variable
- Reviewing the range of the weight variable
- Examining the distribution of the weight variable
- Reviewing the effective sample size
Case study
The case study is from a study on attitudes to gay marriage and is weighted by age, gender, and region. The data is from November 2004 and was collected by the Pew Research Center. After data cleaning, the sample size is 1,837.
Initially, an attempt was made to create cell weights using the targets shown below based on age-by-gender-by-region. The raw data is here and the targets are below.
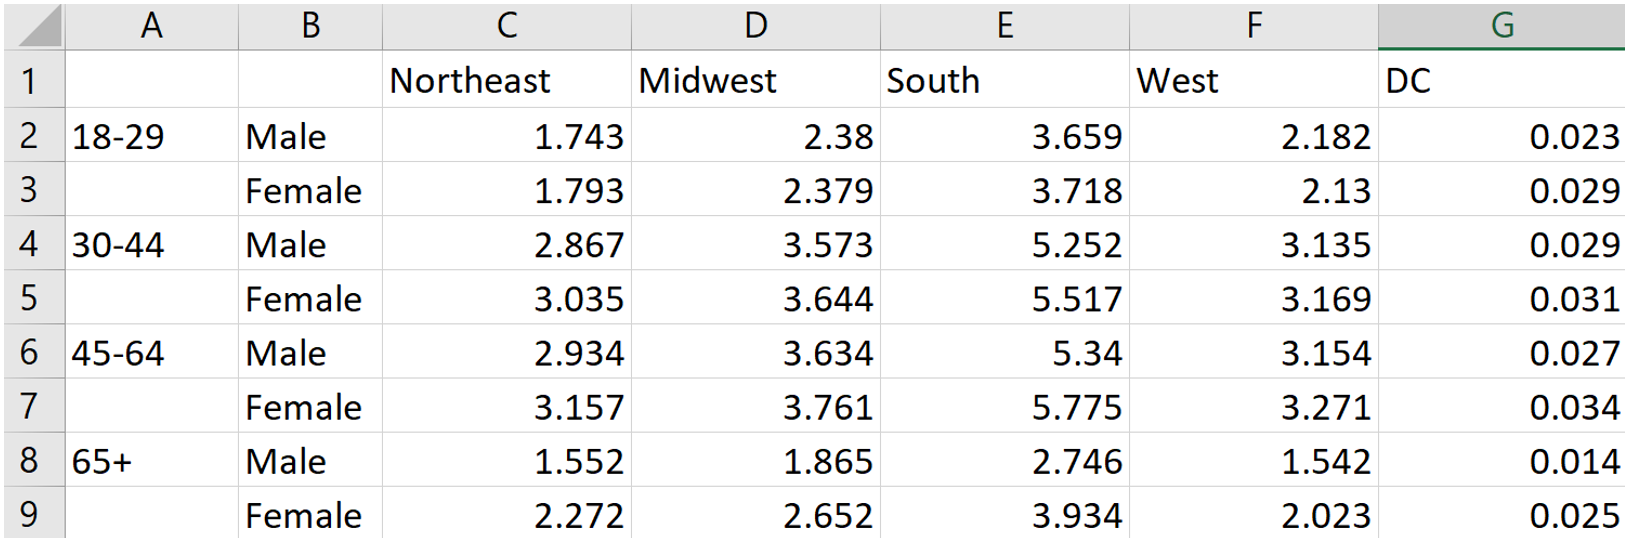
Attempting to use these as weights led to an error, as the survey itself contained no respondents in DC except for one female aged 65+:
This problem was rectified by merging DC with the South.
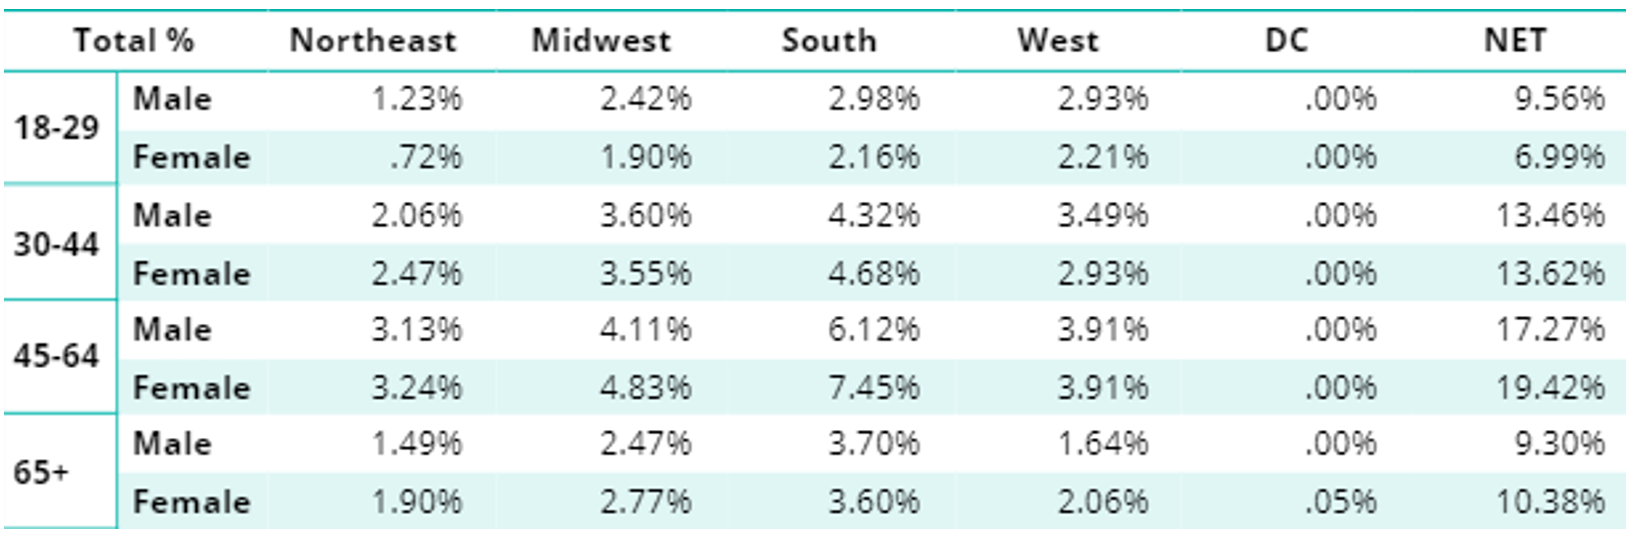
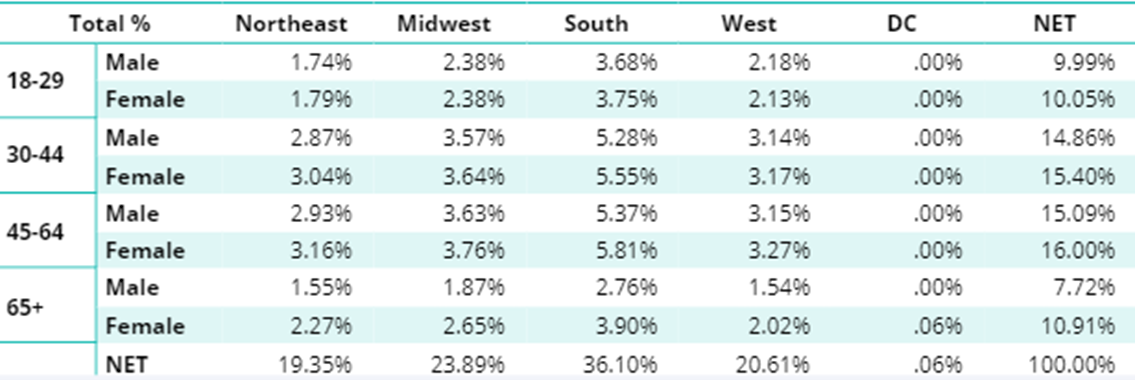
Comparing weighted tables of adjustment variables with the targets
The most fundamental check when weighting data is that the weighted analyses of the adjustment variables correspond to the targets used when creating the weights. Unless trimming is used, the weighted values should be essentially identical to the targets.
The table below shows the survey after applying the weight variable.
 Comparing weighted and unweighted tables of key variables
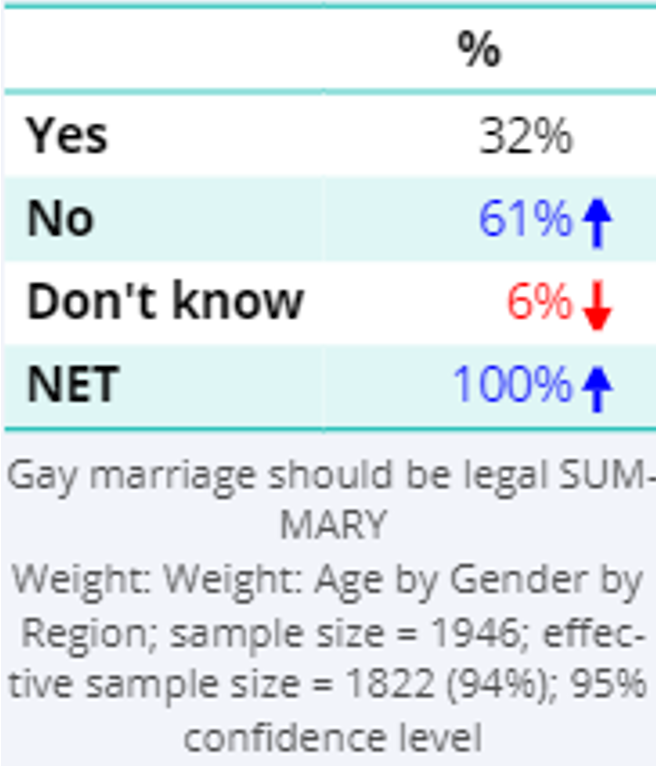
The key variable of interest in the study measures whether people believe gay marriage should be legalized. Prior to weighting, the result was:
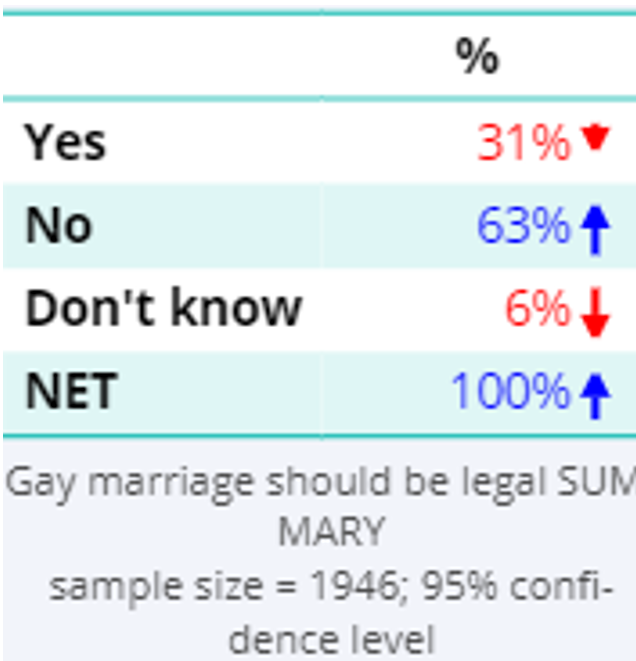
After weighting, the results only changed a little, suggesting that weighting probably was not required. However, it is not uncommon for samples to be weighted even when they don't need to be, as a sample being weighted can be viewed as evidence that the data analysis has been performed rigorously.
Checking the average of the weight variable
Typically, weights are created to have an average of exactly 1 (and not, for example, 1.01). It is always a good idea to check the average, as:
- If the average is not 1.0 it may signify that an error has occurred when creating the weight.
- If using non-specialist software for analyzing surveys, such as R and SPSS, analyses can be very wrong if the average is above this value.
Reviewing the range of the weight variable
The minimum and the maximum values of the weight variable are also indicators of the quality of the weight. Various rules of thumb exist regarding the maximum weight that should be used, such as that it should not exceed 3.5, 4, or 5. (Where the maximum is set to 5, it means that some observations will be weighted 5 times the average).
Similarly, rules of thumb also exist for the lowest value, such as that it must be greater than 0.2 or 0.33.
When checking the range, keep in mind that the minimum and maximum are related. That is, if the minimum is set to 0.2 and the maximum is set to 5, this means that some respondents will be given 25 times more weight in the analysis than others.
The minimum and maximum weights for the case study are shown below. This tells us that the maximum weight is more than three times the minimum weight. This falls within the ranges described above, which suggests it may not be a problem.
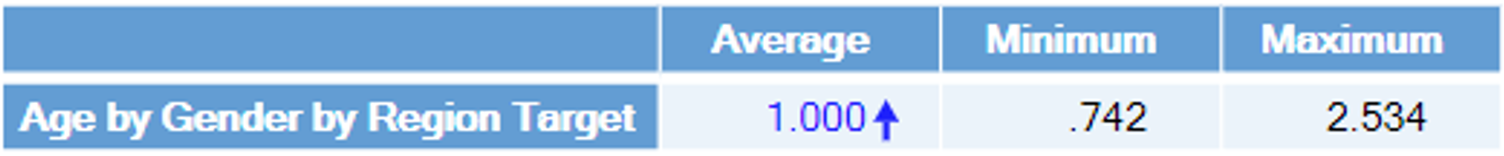
A practical problem with such rules of thumb is that they are just made-up rules with no theoretical basis, as illustrated by the case study. Surveys often intentionally over-recruit subgroups (e.g., buyers of a particular brand), which means that large ranges of weights are appropriate.
Examining the distribution of the weight variable
The histogram of the weight variable is shown below. We can see that the maximum of 2.534 is an outlier, and only 6% of weights are greater than 1.3.

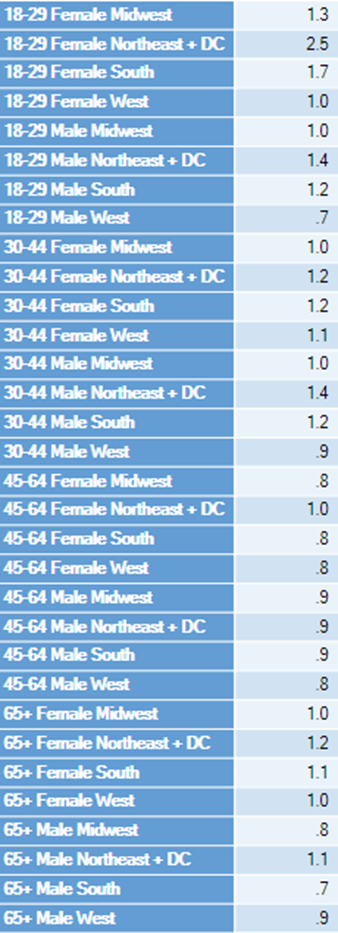
The distribution of the weights can further be explored by seeing how weights differ by the adjustment categories. The table below shows the average weight by age, gender, and region. We can see that the outlier is 18 to 29 females in the Northeast + DC.
Reviewing the effective sample size
In the case study, the effective sample size is 1,837, which is 94% of the original sample size, so the cost of the weighting in terms of reducing the effective sample size is near trivial.
A common question from people that are new to weighting is to ask “what is an appropriate effective sample size?”. There is no good answer to this question, other than to say it should have the same answer as “what is a good sample size?”. But, having said that, effective sample sizes of less than 70% tend to be a concern if not anticipated, and effective sample sizes below 20% are, if not anticipated, potentially highly problematic.
Comments
0 comments
Please sign in to leave a comment.