Screening, routing, and filtering instructions govern which questions respondents see and answer in a survey. They are checked by reviewing raw data, Sankey diagrams, and crosstabs.
What are screening, routing, and filtering instructions?
Screening criteria are questions at the beginning of a questionnaire designed to check the eligibility of respondents. For example, screening out people aged under 18 or who have not purchased the product of interest in the past 3 months.
Routing instructions determine which respondents see and answer which questions (i.e., the route that they take through a survey). For example, only asking people their occupation if you know from an earlier question they are employed.
Filtering instructions govern which options are shown to which respondents. For example, only asking people to show their attitudes towards brands that they are aware of.
Checking using raw data
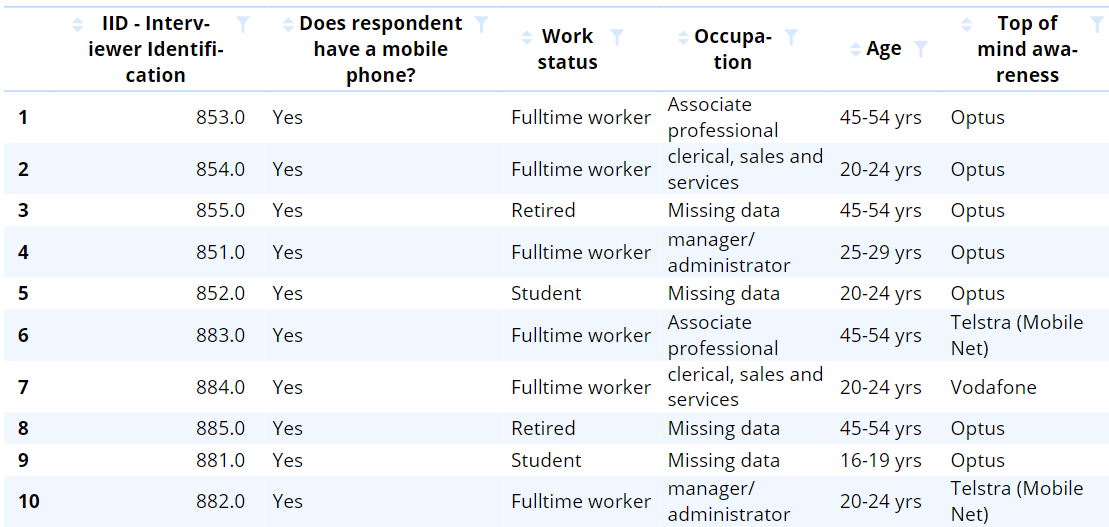
The most basic way of checking screening, routing, and filtering instructions is to review the raw data. The table below shows the raw data for the first five variables in a phone market study. We can see, for example, that we only have Occupation data for people who have a Work status of Fulltime worker.

If checking screening criteria, it can be useful to obtain a data file that includes people that were screened out of the survey, to verify that they should indeed have been screened out.
Eye-balling like this is a useful way of providing a rudimentary check, but it is typically not enough, as it is easy to miss exceptions.
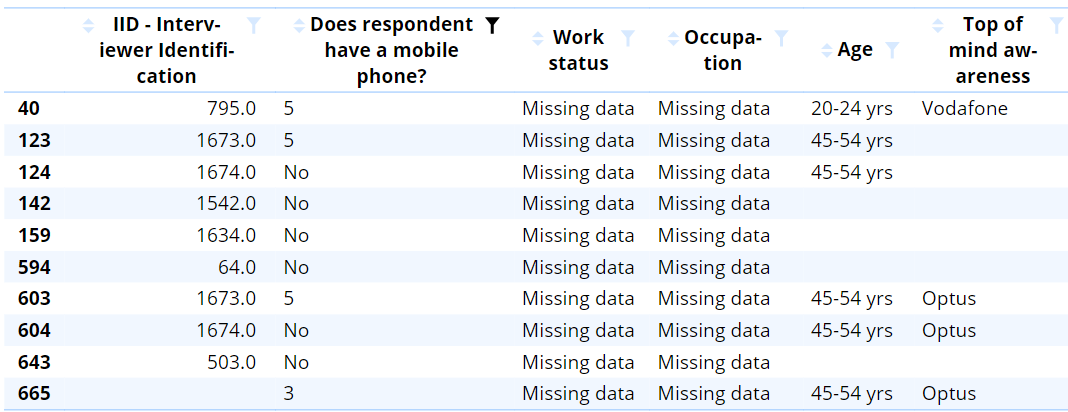
The table below has been filtered to show only people that did not say Yes at Q1 (Does the respondent have a mobile phone?). It confirms that the data for these respondents is, to say the least, patchy.
Sorting data can also be helpful in such circumstances.

Filter summary tables
An alternative to filtering the raw data is to instead create summary tables and filter them based on the desired criteria. For example, if Q2 should only be asked of people that said No at Q1, then you create a summary table of Q2 filtered to only show people that said No at Q1.
Sankey diagrams
Sankey diagrams are a particularly fast way of checking screening criteria and routing instructions. The example below allows us to quickly see that respondents flagged as complete and in quota, were all aged 18 or more, have a known gender, and consumed cola at least once a month.

Crosstabs
A more rudimentary approach is to use crosstabs. For example, the table below shows that we have 2 Part-time workers that have no occupation.

When looking at a Crosstab it is important to inspect the sample size information. In the case of the table above, this is shown in the bottom-right corner and in the table footer. This tells us that the table is based on a sample of 336 respondents out of the total sample of 725. The reason for this is that most software excludes people from crosstab tables where the people have missing data on either variable. Consequently, when checking data using crosstab tables it is generally a good idea to recode the data so that missing values appear on the table.
The table below uses the data from all 725 people. It gives us a better understanding of the missing data issues. We can see that, as we might expect, most of the people with Missing data for Occupation (the rows) are Students, Homemakers, Retired, or Part-time workers. But there are also some inconsistencies in the data, with the -9 and 0 categories, as well as the issues identified in the earlier table.

Comments
0 comments
Please sign in to leave a comment.